 Your new post is loading...
In a new survey conducted in September 2014, the Pew Research Center finds that Facebook remains by far the most popular social media site. While its growth has slowed, the level of user engagement with the platform has increased.
Other platforms like Twitter, Instagram, Pinterest and LinkedIn saw significant increases over the past year in the proportion of online adults who now use their sites....
Via Jeff Domansky
Facebook is for ice bucket challenges. Twitter is for Ferguson, Mo. That’s been the conventional wisdom in the past few months; that conversation about breaking news is happening mostly on Twitter, while people are using Facebook to share less timely — some would say less newsworthy — topics. The evidence for this conclusion has been anecdotal, which is almost always the case when you are comparing results produced by Facebook’s opaque News Feed algorithm to anything. So any time there’s a chance to dig into data that sheds light on public social sharing activity, it’s wise to seize it.
The quarterly report of consumer sharing behavior published this week by social data and sharing tool provider ShareThis offers such an opportunity. And while the data, drawn from the 450 million unique users and 2.5 million sites and apps in the ShareThis network, doesn’t directly address the ice-bucket-vs.-Ferguson question, it does provide some interesting marketing takeaways....
Via Jeff Domansky
The number of shares an article receives has become ubiquitous in online content; widgets that show shares, tweets, pins, and +1s appear front and center on nearly every post you read (or, in this case, just to the left of this paragraph).
Just how many times does content get shared? Where do people prefer to share it? And are some publishers more effective than others at generating highly shared content? These questions are crucial to content marketers looking to understand the key components of a viral marketing success, and our recent research collaboration with BuzzSumo is here to give you some answers....
Via Jeff Domansky
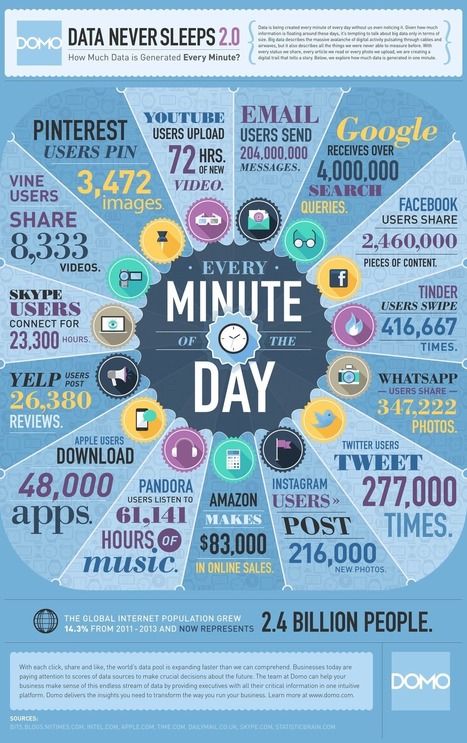
Here’s the thing: the internet never sleeps.
Which means data never sleeps, and the internet sure likes to use up a lot of it. How much? In any given minute, 277,000 tweets are published on Twitter, 216,000 photos are sent to Instagram and 8,333 videos are shared on Vine.
And we’re just getting started. Over that same 60 second period, 347,222 photos are sent on WhatsApp, 416,667 swipes are made on Tinder and 3,472 images are pinned on Pinterest.
And if you think that’s impressive, Google receives 4 millions search queries, Facebook users share 2.46 million pieces of content and 204 million email messages are sent each and every minute of the day.
This visual from DOMO looks at how much data is generated every minute across the net....
Via Jeff Domansky
How Much Data is Created Every Minute an infographic Every minute massive amounts of it are being generated phone, website application across the Internet.
...I don’t anticipate the growth of data slowing down in my lifetime. There’s too much goodness to be mined from it all.
Recently, we decided to revisit the topic and found, not surprisingly, that the pace of data creation continued to accelerate. Our first infographic, for example, showed that Facebook users shared 684,478 pieces of content. Fast forward a couple of years and that number has exploded to 2,460,000 pieces. Insane....
Via Jeff Domansky
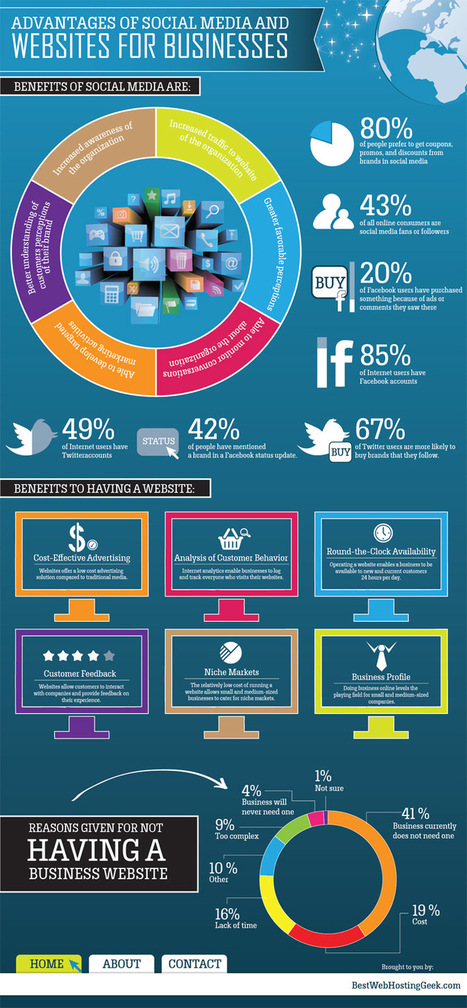
Why Your Business Needs A Business Social Media Presence. Online consumers are more likely to buy things from brands they know or have followed through social media for some time.
An infographic published by Mr. Youth, a word of mouth marketing firm, polled 4500 adults to uncover the impact of social media on purchases. They discovered that social media not only influences brand reputation and PR, but often can lead directly to a sale.
Over 90% of respondents either received or made recommendations to friends and families on Facebook. 65% of these social recommendations directly led to a purchase. On top of that, 80% of those who received a response to a social media post by a brand made a purchase as a result of that interaction.
With numbers as striking you’d think businesses would be quick to comprehend. Yet according to the study, brands only respond to half of their social media posts, divided almost equally between Facebook and Twitter. The full report will be available in two weeks....
Via Jeff Domansky
Talk about big data ... Huge Web Graph, with 3.5 billion pages and 128 billion hyperlinks is now publicly available for web and network research. This is probably the largest publicly available graph.
Via Jeff Domansky
|
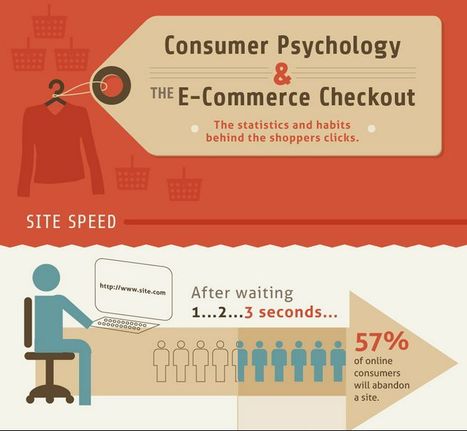
We all love a bit of online shopping but what goes through our head before we click to buy items over the web?
We have done some research in the form of an infographic, which reveals some fascinating insights into the psychology of the online consumer.
A massive 85% of people said they read online reviews before making a purchase and 1/3 of shoppers admitted buying an item after being influenced by a video. The research also looks into why we abandon sales at the checkout, which is predominantly down to hidden charges and having to register before buying.
Check out our infographic below for the full insight into the mind of the online shopper....
Via Jeff Domansky
A study released by the Acquity Group, part of Accenture Interactive, has found that 94 percent of B2B buyers conduct some research before making a purchase, with 55 percent of them doing so for at least half of their purchases.
XThe “State of B2B Procurement” report looked at 500 B2B procurement officers with annual purchasing budgets of approximately $100,000. The goal was to determine how B2B companies adapt and stay competitive through their purchasing decisions.
About 68 percent of B2B buyers purchase goods online, compared to 57 percent cited in the 2013 version of the study. Nearly 44 percent of respondents said that they researched goods and services on a smartphone or tablet over the past 12 months....
Via Jeff Domansky
Local is the new global. Social Media Marketing expert Andrea Vahl shares tips on using the global network that is social media to get found locally!
Via Jeff Domansky
Most online mentions of companies by consumers are neutral, rather than overtly positive or negative, according to a recent report from mention.
The study, which was based on an analysis of 1 billion global mentions of 200,000 companies across social networks and websites, found 75.5% of all interactions to be run-of-the-mill, such as questions about products and requests for customer service.
Of the remaining mentions, 17.6% were clearly positive and only 5.8% were clearly negative....
Via Jeff Domansky
...In one minute, email users send 204 million messages, Amazon makes about $83,000 in online sales and Apple users download 48,000 apps. On the social front, Facebook users share 2.46 million pieces of content, 277,000 tweets are tweeted and Tinder users swipe left or right 416,667 times.
We've never seen a small town quite like that.
The folks at Domo have created an infographic detailing a chunk of the incredible amount of data the Internet generates each minute....
Via Jeff Domansky
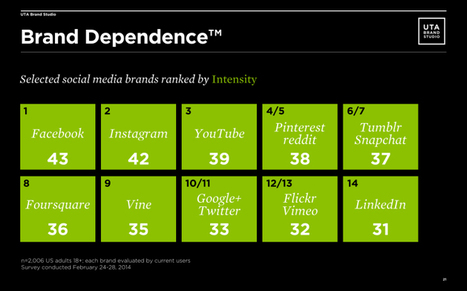
Understand which social media brands your audience is attached to and dependent on - then be creative with how you can help reinforce their identity.
Discovering that Twitter didn’t even make the top five social media brands that people are most attached to was one of the most intriguing things from a new study released last week by UTA Brand Studio on which social media brands users are most attached and dependent on with Facebook coming out on the top. Instagram, YouTube, Pinterest and Reddit followed.
According to the UTA Brand Studio:Brand dependence measures how strong of a connection people have to a brand (brand- self connection) as well as how easy their thoughts and feelings about a brand come to mind (prominence)...
Via Jeff Domansky
As social networks have exploded in their use as a critical marketing and PR channel for businesses of all size, so have increased the importance of measuring all this effort more effectively. Apart from apprising you of the success of your strategies, measurement also gives you very critical insights about your customers and competitors. As you go on investing in social media channels, it is these actionable insights, which give you a return on your dollar.
However, the measurement of social media is not as standardized as it should be. This is mainly because of the evolving nature of social networks itself. This non-standardization also means that you will be flooded with advice and opinions about how to measure social media. This leads to some critical mistakes, which can jeopardize accuracy of your results. This in turn will lead to dismissal of social media as an effective channel in business strategy! But we all know importance of social media as well as measurement, so let us see the most common mistakes which are committed while measuring social media....
Via Jeff Domansky
|


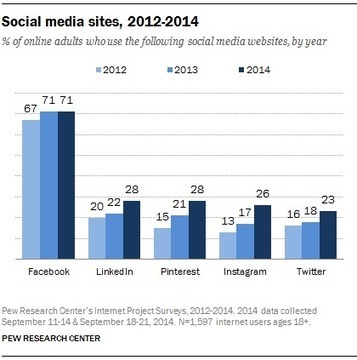


While Facebook remains the most popular social media site, other platforms — like LinkedIn, Pinterest, Instagram and Twitter — saw higher rates of growth over the past year.
2014ko datuak. Facebook garaile.