


Never run out of Blog Post Ideas with this Infographic.
Learn more:
- https://gustmees.wordpress.com/2013/03/25/practice/
- https://globaleducationandsocialmedia.wordpress.com/2014/07/02/put-your-title-in-here/
Via Gust MEES
Get Started for FREE
Sign up with Facebook Sign up with X
I don't have a Facebook or a X account


 Your new post is loading...
 Your new post is loading...
Your new post is loading...
Never run out of Blog Post Ideas with this Infographic.
Learn more:
- https://gustmees.wordpress.com/2013/03/25/practice/
- https://globaleducationandsocialmedia.wordpress.com/2014/07/02/put-your-title-in-here/
Via Gust MEES 
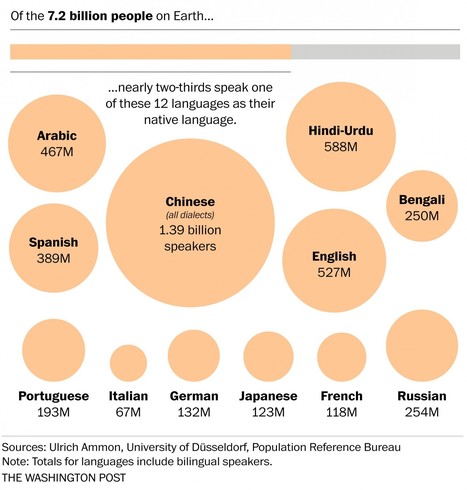
"These seven maps and charts, visualized by The Washington Post, will help you understand how diverse other parts of the world are in terms of languages." Tags: language, culture, infographic.

Caitlyn Christiansen's curator insight,
May 26, 2015 10:35 AM
The world is extremely diverse in its spread of native languages. Yet only a handful are commonly spoken by the majority of the world, about 2/3. Over half of the world's languages are expected to go extinct because of the extreme diversity and the minimal distribution which means that in some places almost every person speaks a completely different language and many are dying as their last speakers do not pass it on to their children.
This article is relates to cultural patterns and processes through the geographic spread of languages around the globe and the increasing acculturation that causes the loss of many of these languages in our increasingly globalized world. 
Michael Amberg's curator insight,
May 26, 2015 10:35 PM
Its interesting to see just how many people speak the languages we speak everyday, and to see just how many people DONT speak it. 
Shane C Cook's curator insight,
May 27, 2015 5:34 AM
It is amazing to see all main languages in perspective to the world. Mandarine holding the top spot with 1.39 Billion surprises me but at the same time doesn't. There are 1.3 billion people living there in the first place.

Is your website ready for 2015? Here are 5 of the new trends to look out for in the coming year. From Mobile Focus, Interactive, Flat, Simple, and Single Page Designs – stay ahead of the curve and get on trend for the New Year. Our easy to follow visual guide will show you the way. Via Lauren Moss

Tony Guzman's curator insight,
January 29, 2015 9:55 AM
This infographic shares five trends in web design for this year. 
Scott Wachtel's curator insight,
March 13, 2015 4:05 PM
Major points are spot on. if you're not optimized for mobile reach you are limiting your exposure and potential income.
![A Complete Guide to Social Media Images [INFOGRAPHIC] | Strictly pedagogical | Scoop.it](https://img.scoop.it/BtAGXYJI4g_sg832PMt3njl72eJkfbmt4t8yenImKBVvK0kTmF0xjctABnaLJIm9)
Relevant social media-isms, including image size guidelines, helpful tips & stats - that can help you navigate through the most popular social channels easily. There’s no doubt modern businesses need to be social. But it’s really hard to be successful and keep track image sizes, character limits, pixel requirements, engagement windows, and hashtag optimization, to name a few. It turns out there are methods behind all the madness, so we’ve compiled relevant social media-isms – including image size guidelines and helpful tips & stats – that can help you navigate through the most popular social channels easily... Via Lauren Moss

Olivier Milo's curator insight,
October 22, 2014 1:49 AM
Here's a handy infographic covering many social media. 
google power search
The trouble with something so familiar as the Google search engine is the iceberg principle. You only use the bit you can see, the obvious 10% of the capacity. Once you confine yourself like that, then the results you’ll be getting will be similarly restricted. If you know what you’re doing though, you’ll find what you really need, rather than something that’s been better search-optimised, and you’ll find it quicker. Via Elizabeth E Charles

How often do you use Google to find something on the internet? If like a lot of people you use Google every day you’ll be astounded by the number of hidden tips and tricks their search facility offers. Find 46 of them featured in this infographic. Via Lauren Moss

Kelly 's curator insight,
January 9, 2015 10:46 AM
Nothing hidden about these "tips & tricks" - just standard every day library functions. This is not new, most these functions have been used since Win95, the days before we see the net as we do now. Nonetheless, whatever it takes for people to finally catch up and educate themselves about easier searching techniques! 
Teresa Maceira's curator insight,
April 8, 2016 8:32 PM
Add Google hacks to a students research skill set

Beth Dichter's curator insight,
July 13, 2014 6:40 PM
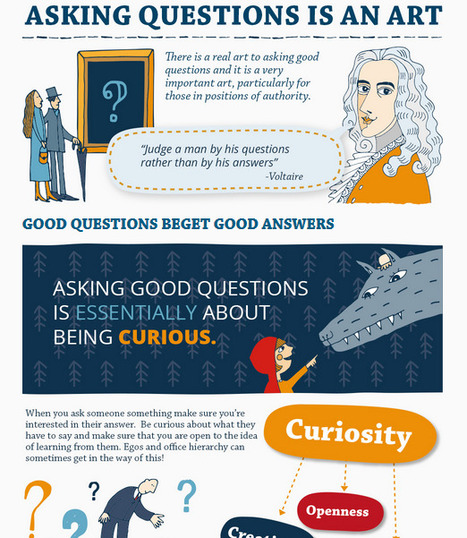
This lengthy infographic explores the The Art of Asking Questions. Areas of the infographic include: * Wrong Question, Right Answer * Good Questions Beget Good Answers * The Golden Rule = No Closed Questions * Rules were made to be Broken - Probe - Funneling - Specific to Broad OR Broad to Specific * Leading Questions There are also four images of "Thinkers on Asking Questions." You roll over the image and see what they have to say about asking questions This is an infographic that could lead to a great classroom discussion on questioning.
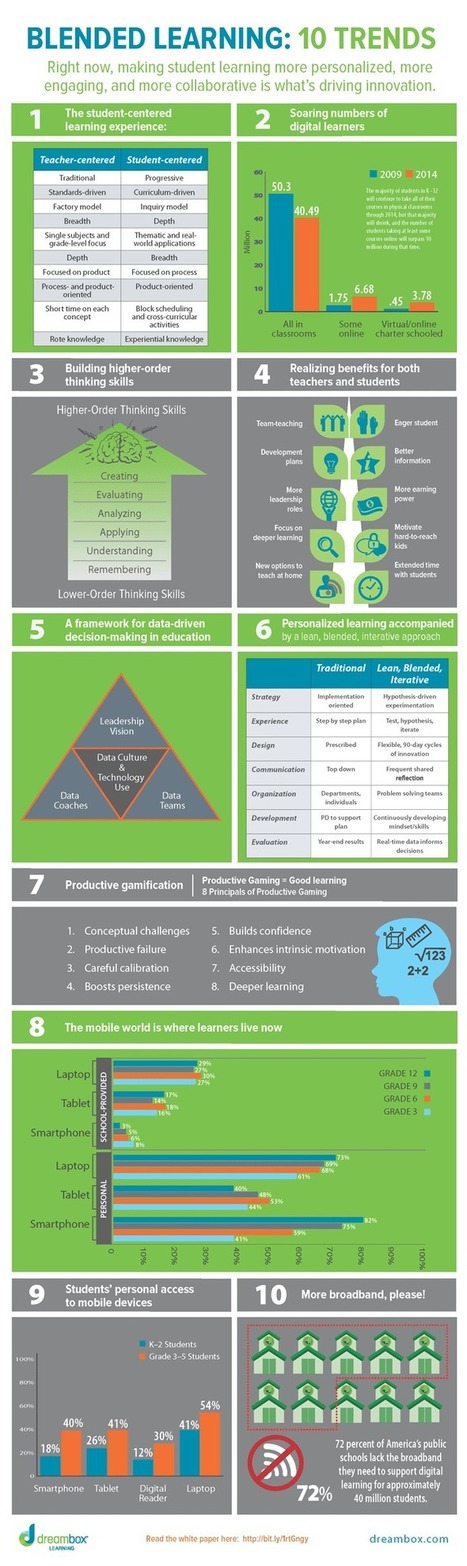
There is mounting evidence that complementing or replacing lectures with student-centric, technology-enabled active learning strategies and learning guidance—rather than memorization and repetition—improves learning, supports knowledge retention, and raises achievement. These new student-centered blended learning methods inspire engagement, and are a way to connect with every student right where they are while supporting progress toward grade level standards.

Lara N. Madden's curator insight,
May 19, 2014 1:45 PM
This blended/hybrid & flipped classroom movement intrigues me. Add badging and we will have the trifecta of all elearning. 
Clare Stefanich's curator insight,
October 18, 2019 6:44 PM
This info-graphic highlights some of the trends and innovations that are influencing classrooms and student-centered blended learning models today.
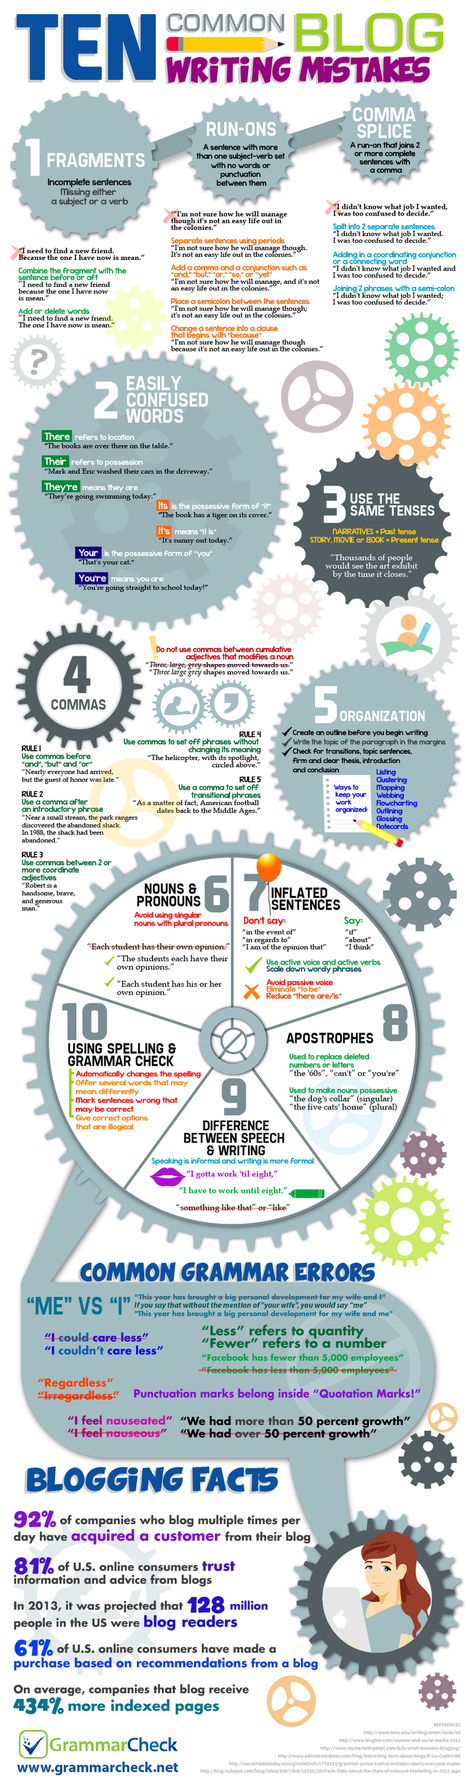
Ever wondered what the most common grammar mistakes are that bloggers make? Run-on sentences, punctuation, or maybe use of wrong tenses? This infographic highlights common blog post writing errors and blogging facts. Via Lauren Moss

Phillip Newsome's curator insight,
September 26, 2014 10:11 AM
92% of companies that attributed the acquisition of just 1 customer from blog activity posted multiple times per day. Stay focused on your customers and hire a competent writer to handle this activity. 
Christopher Lopez's curator insight,
October 7, 2014 12:38 AM
Blogging is very essential to attract customers. It should be flawless. 
Helen Stark's curator insight,
October 7, 2014 10:17 AM
Cool infographic that will be useful for any blogger.
![Four Ways Technology Is Changing How People Learn [Infographic] | Strictly pedagogical | Scoop.it](https://img.scoop.it/JCJ_XneGzBoYSXq6Ecco2Tl72eJkfbmt4t8yenImKBVvK0kTmF0xjctABnaLJIm9)
"Today, more than ever before, technology plays an important role in society. It is changing and will continue to change every aspect of how we live. It is changing the way we communicate, the way we do business, how we learn and teach, and even it’s changing the way our brains work." Via Beth Dichter
Beth Dichter's curator insight,
February 22, 2014 7:05 AM
This infographic provides four key points about e-learning. When you click through to the post you will find detailed descriptions for each of the four ways technology is changing how people learn. * What does it mean to move from individual to collaborative learning? * What is this shift from passive to active or brain based learning? * Multitasking - Does it work? The infographic is very simple and it worth reading the text (which is above the inforgraphic when you click through).
![How to Disappear from the Internet [INFOGRAPHIC] | Strictly pedagogical | Scoop.it](https://img.scoop.it/7Y9rC3ugylCOUYu3n49W_Dl72eJkfbmt4t8yenImKBVvK0kTmF0xjctABnaLJIm9)
The amount of information available online has gotten out of hand. Everything about our lives, from where where we went to high school and what we ate for breakfast this morning, can be found on the internet. If you think that's bad, think about children growing up today – their entire lives, from infancy through middle school, are being documented by their parents on Facebook! Privacy just doesn't exist online anymore; it can take drastic measures to delete ourselves from the internet, but here's a step-by-step guide for those who want to do so... Via Lauren Moss
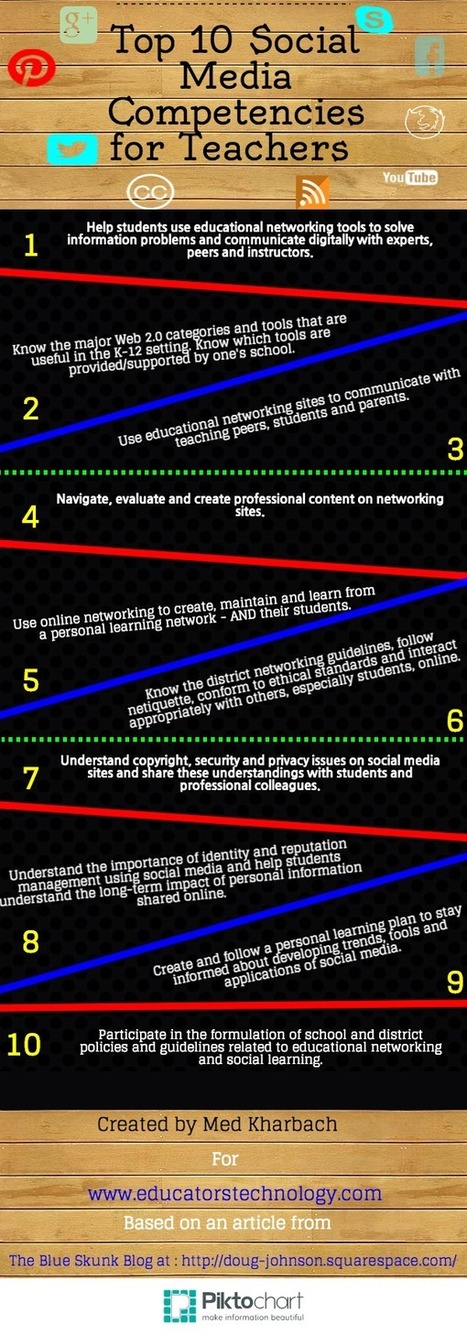
The potential of social networking sites in education is huge and we need to capitalize on it to enhance our professional development and consequently improve the quality of our instruction. Searching for articles on this topic , I came across Doug Johnson's post on the 10 social media competencies for teachers [http://doug-johnson.squarespace.com/blue-skunk-blog/2010/7/31/top-ten-social-media-competencies-for-teachers.html ]. I like the competencies Doug included and decided to make an infographic featuring all of these skills. Have a look and share with your colleagues. Via Elizabeth E Charles

Amy Weisz's curator insight,
January 21, 2014 9:38 AM
These are necessary skill for all teachers to help make our students "college and career" ready. 
Epict Italia's curator insight,
January 25, 2014 3:47 AM
Le competenze del docente che usa strumenti "Social"
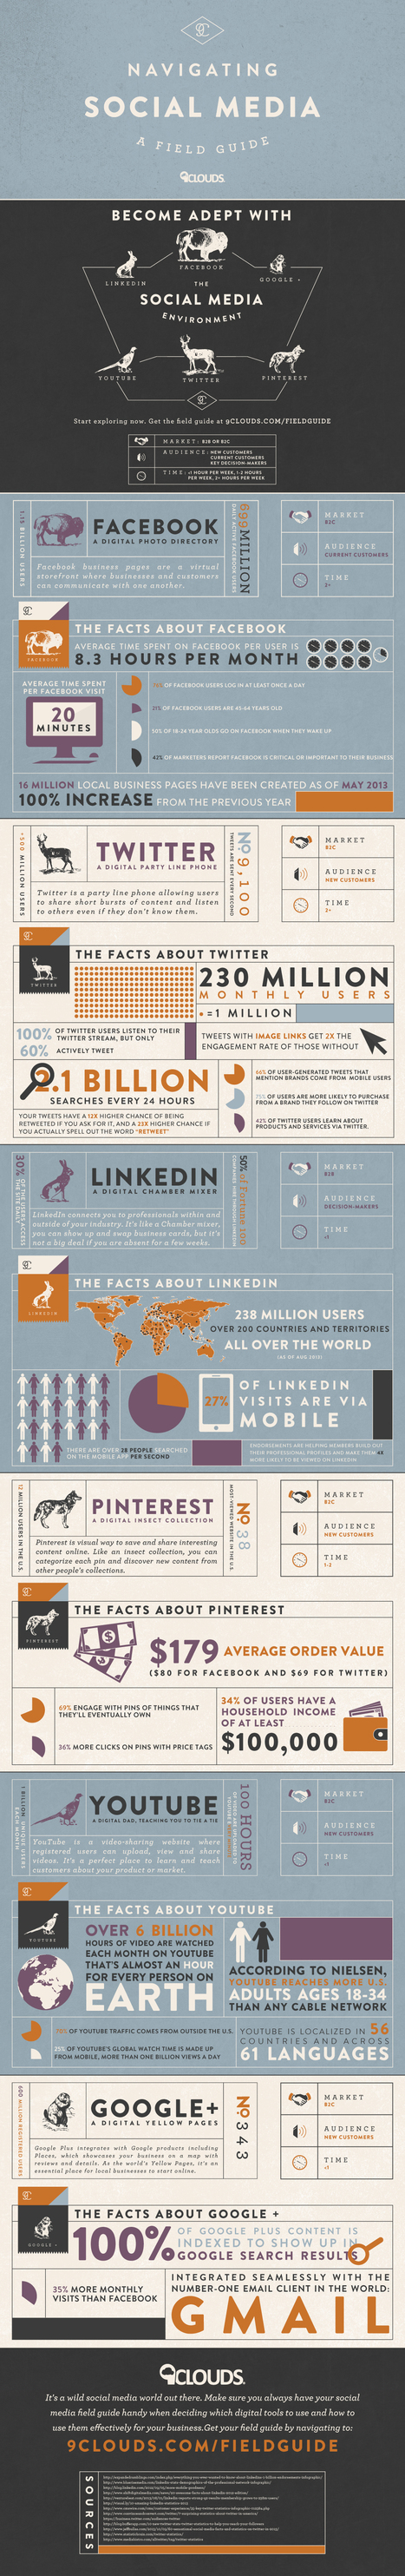
Why should you use a specific social media network? Learn which network is best for you, how much time it will take and why you should use it in this social media infographic. The social media infographic includes key stats, target markets, audiences and the time commitment for each network. Via Lauren Moss

thomas junillon's curator insight,
December 16, 2013 4:53 AM
Chiffres-clés sur les principaux réseaux sociaux : twitter, Google+, Facebook... Toujours bons à avoir sous la main pour conforter vos dires ! |
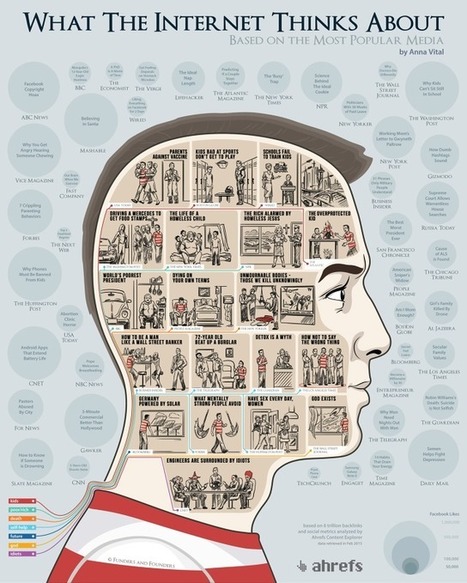
What does the Internet care about? What articles do we share the most? Using the data from the Ahrefs Content Explorer, the people at Funders and Founders Via Lauren Moss

Emilio Ruano's curator insight,
May 4, 2015 1:17 PM
At least, the concern about equality, energy and social welfare is there. I like the last one about engineers tho. Hahaha. 
Mackenzie Hamilton's curator insight,
October 13, 2015 8:36 AM
I think this article is awesome because they use data visualization to show what people share the most, visit the most, and search the most. Data is everywhere and people are using it everyday and sometimes don't even think about it.
![8 Ways to Engage eLearners [Infographic] | Strictly pedagogical | Scoop.it](https://img.scoop.it/LvNP43jZt6WV_ZNARo-FqTl72eJkfbmt4t8yenImKBVvK0kTmF0xjctABnaLJIm9)
The 8 Ways to Engage eLearners Infographic provides 8 tips that will leave your learners energised and primed to look at your learning in a different light.
Learn more:
- http://www.scoop.it/t/21st-century-learning-and-teaching/?tag=Engage-ME%21
- https://gustmees.wordpress.com/2014/10/03/design-the-learning-of-your-learners-students-ideas/
- https://gustmees.wordpress.com/2015/01/28/practice-learning-to-learn-example-2/
- https://gustmees.wordpress.com/2013/01/23/is-your-professional-development-up-to-date/
Via Gust MEES

terry clarke's curator insight,
March 4, 2015 11:01 PM
Superb graphic of the 8 steps important to engaging e-learners, along with an excellent collection of links providing more tips for the teacher/professor whose course includes distance-learners. I certainly could have used this information my last half dozen years as a Marshall Graduate College professor/lecturer!
Tony Guzman's curator insight,
March 5, 2015 10:54 AM
This infographic shares 8 excellent tips on how to keep your online learners engaged. 
RESENTICE's curator insight,
March 6, 2015 7:57 AM
8 astuces pour dynamiser les parcours de formations en ligne et les rendre plus attractifs...

Via Leona Ungerer

Alison DeBoe's curator insight,
November 22, 2014 5:29 PM
This takes a step by step process of how to make a research project into a infographic. It shows pictures and explains how it happens. I'm excited to see how it works!

Autism Daily Newscast's curator insight,
September 10, 2014 4:26 AM
Not an app but close enough - love it. 
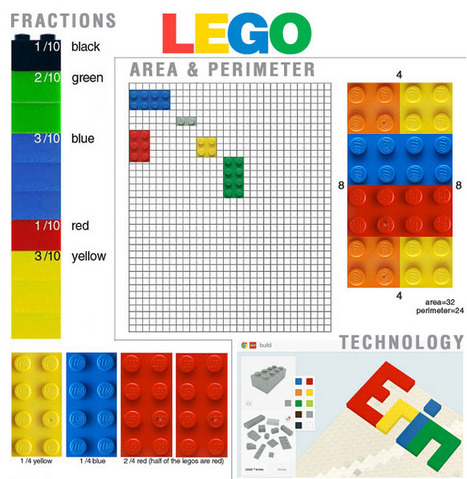
Elizabeth Bowden's curator insight,
September 12, 2014 7:52 PM
In addition to using Lego for maths, I've taken my sons (extensive) Lego collection into History and Society & Culture to have the students (high school) demonstrate their understanding of concepts such as globalisation, communism, nationalism, capitalism. Worked really well and classes sooo happy.
Having been broken up into groups and given a concept each, They created cities or environments demonstrating the concept then talked the rest of the class through. 
Ness Crouch's curator insight,
September 13, 2014 4:06 PM
Fantastic ideas for using lego in mathematics. Simple hands on tasks. 
The beginning of the new school year is a great time to introduce students to new web search strategies or review the ones they already know. The folks at Canva put together a nice infographic abou... Via Elizabeth E Charles

Jo Blannin - The Know Tech Teacher's curator insight,
August 26, 2014 7:48 PM
Love this infographic - walks students (Grade 5 +) through the use of Google search strategies. I've put this up in the classroom so that I can refer to it. With primary school kids, its not really a 'work alone' resource but it is great for using as a reference point to direct their research and search skills. 
Melissa Marshall's curator insight,
August 26, 2014 11:30 PM
A great infographic to remind kids on how to find precisely what they are looking for. Remember, Google is not a person - do not ask it questions! Instead, use precise keywords and get familiar with the Advanced tools. 
Rocio Watkins's curator insight,
September 1, 2014 11:15 AM
So timely for the beginning of the school year!
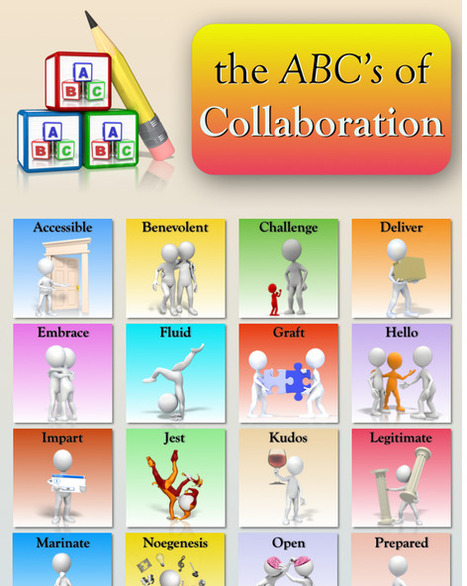
Beth Dichter's curator insight,
July 13, 2014 8:08 PM
Dan Pontrefract has published a book called Flat Army: Creating a Connected and Engaged Organization. In this book he define collaboration as: The unfettered allowance and encouragement of employees to both contribute and consume knowledge, insight or ideas with any direct relationship via professional or personal networks to achieve an outcome. In addition to this definition he has created two infographics that look at the ABC's of Collaboration. One infographic provides a key word for each letter of the alphabet as well as an image (as shown above). The second infographic also includes a definition for each word. We know that collaboration is not always easy for students. The two versions available would be useful for different grade levels. In the younger grades students might share what they believe these words mean, or you may choose one or two key words to use for specific tasks. The version with definitions might be useful in promoting a dialogue with older students. Do they agree with the definition? Is there a word that they think might better reflect collaboration that takes place in a classroom?
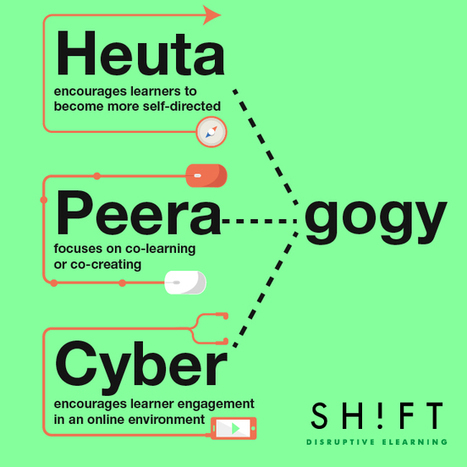
These three "gogies" of effective online learning will help you get a clearer picture of learning and eLearning in the digital age. Learn more: - http://www.scoop.it/t/21st-century-learning-and-teaching/?tag=Heutagogy Via Beth Dichter, SUSANA APARICIO, Gust MEES

Julie Lindsay's curator insight,
September 1, 2014 7:03 AM
We need to be considering multi-pedagogical learning as a consequence of integrating technology with learning. 
Raquel Oliveira's curator insight,
December 1, 2014 7:09 AM
#avancee 3 conceitos sobre a aprendizagem do seculo XXI 1- HEUTA- encoraja os aprendizes a serem auto-direcionados 2- PEERA- foco em co-aprendizagem e co-criacao 3- CYBER- Encoraja engajamento dos aprendizes no ambiente de aprendizagem on line.
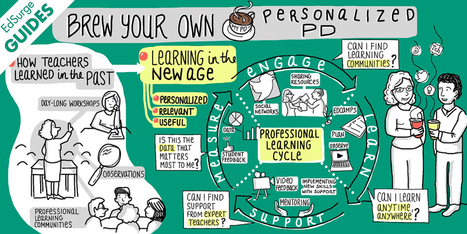
That's great for students but what about teachers? Where's the personalized learning, the carefully constructed playlists, the pitch-perfect material that fits their grade level and subject needs and interests? Social networks like Twitter too!

Marta Torán's curator insight,
April 25, 2014 5:46 AM
Una guía con gran cantidad de recursos y referencias sobre el aprendizaje personalizado de los docentes.
![Social Media Security Tips [INFOGRAPHIC] | Strictly pedagogical | Scoop.it](https://img.scoop.it/yAL6HkEXVxZCTVPd6K1Yjjl72eJkfbmt4t8yenImKBVvK0kTmF0xjctABnaLJIm9)
In the past 5 years social media growth has exploded around the globe and, as platforms such as Twitter and Facebook expand and begin to increasingly mirror and reflect “real life”, they take on many of the problems of the offline world, too. For example: security. With millions of social media views, updates and registrations taking place literally each and every minute, the potential for identify thieves, hackers and good, old-fashioned burglars to exploit your personal information has never been greater. Which means it’s solely your responsibility to ensure you’re protecting yourself when using these channels... Via Lauren Moss

Javier Antonio Bellina's curator insight,
March 27, 2014 5:41 PM
Brechas de Seguridad en las Redes Sociales: Una Infografía:
![What Is Social Learning (And Does It Work)? [Infographic] | Strictly pedagogical | Scoop.it](https://img.scoop.it/fiRSvXGcyxLpriLvgBy2cjl72eJkfbmt4t8yenImKBVvK0kTmF0xjctABnaLJIm9)
Distance learning, e-learning, mobile learning, blended learning. There are a slew of educational learning trends that have been happening for years now. A Via Gust MEES

Maureen Greenbaum's curator insight,
January 19, 2014 7:40 PM
The inforgraphic is great but the article is also very insightful There is a generation whose starting point for information & engagement is not printed materials (a book, a newspaper) – but online social platforms

Did you know that there are 92K plus articles posted on the internet with 1.19 Billion+ engaged minutes every single day? In other words, 1,194,902,462 engaged minutes is roughly 10 seconds per every person on earth or 2273 years of time. Via Lauren Moss

Lori Wilk's curator insight,
December 19, 2013 11:28 AM
It is amazing how much content is placed on the Internet every minute 
Ray Beauchamp's curator insight,
December 28, 2013 4:24 PM
Did you know that there are 92K plus articles posted on the internet with 1.19 Billion+ engaged minutes every single day? In other words, 1,194,902,462 engaged minutes is roughly 10 seconds per every person on earth or 2273 years of time. |


![The 6 Thinkers who Transformed Education and Pedagogy [Infographic] | Strictly pedagogical | Scoop.it](https://img.scoop.it/G4AH486ZFAskBJM8TDUbjDl72eJkfbmt4t8yenImKBVvK0kTmF0xjctABnaLJIm9)


Never run out of Blog Post Ideas with this Infographic.
Learn more:
- https://gustmees.wordpress.com/2013/10/14/practice-using-blogs-for-home-work-to-get-ict-skills-and-creativity/
- https://gustmees.wordpress.com/2013/03/25/practice/
- https://globaleducationandsocialmedia.wordpress.com/2014/07/02/put-your-title-in-here/
Best list of writing topic suggestions, especially for professional blogs, I've seen in a long time. Thanks to Gust Mees for the tip.