Your new post is loading...

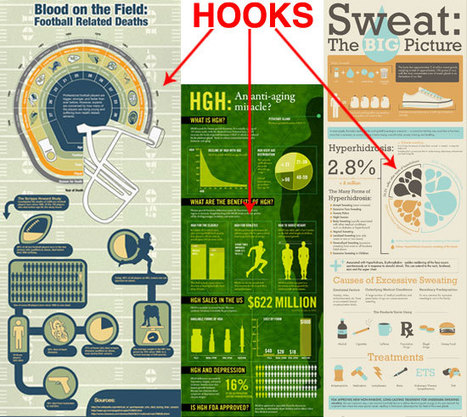

Infographics are visual representations of information, or “data viz” as the cool kids call it these days.
Here's a great article on how to create infographics, or tell a story using 'data viz.'
Translating data into a story is tough work and this article gives us some fabulous tips on how to do it.
Not a graphic designer? Don't worry -- as a business person the more you know about how to create a great data viz story, the better you can tell a graphic designer or graphic scriber what you want.
Another reason I like this article is because it actually mentions the need to create a storyline for your visual, and know before had what the key message is you are trying to deliver.
The storytelling points the article leaves out are the storytelling devices of metaphor, analogy, contrast, and sensory material that are critical to a story's and an infographic's success. These pieces are implied in the article, but need more direct discussion about.
Use this article as a great guide. And if you want more detail, go dig into "Visualize This" by Nathan Yau (although it can be pretty technical).