Visualization Techniques and Practice
16.3K views | +0 today
Follow
Visualization Techniques and Practice
How to use visualization techniques for nonprofits in areas like data analysis, learning, facilitation, and innovation
Curated by Beth Kanter
Your new post is loading...
Rescooped by Beth Kanter from visual data
Scoop.it!

Data Analytics & Big Data: An infographic guide

Data Analytics & Big Data: An infographic guide | Visualization Techniques and Practice | Scoop.it

The quick reference guide to big data and data analytics; from the definition to the history and future applications of big data.


Via Lauren Moss
Aurélia-Claire Jaeger's curator insight, January 31, 2013 3:03 AM

Superbe infographie pour un résumé en image !

Shawn Neville's curator insight, January 31, 2013 10:49 AM

Big Data clarity from Deloitte....

Rescooped by Beth Kanter from visual data
Scoop.it!

6 Illuminating Big Data Infographics

6 Illuminating Big Data Infographics | Visualization Techniques and Practice | Scoop.it

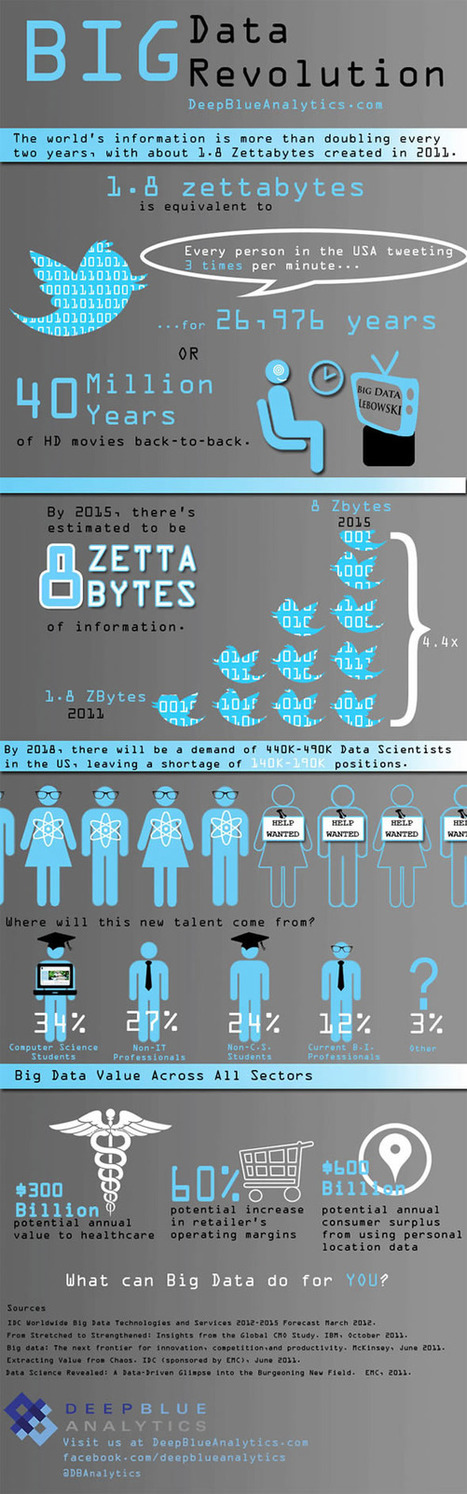
Is Big Data still a big mystery to you? 

In recent years, the volume of information coming into companies has exploded, so that many IT organizations are dealing with extremely large sets of data. 

IT leaders are rethinking many aspects of how they manage and deliver information, from investments in infrastructure and analytics tools to new policies for organizing and accessing data so they can deliver more of it, faster. They are concerned that if they don't have the right tools and architectures to deal with all that information, then big data can be a big problem. Check out these infographics on Big Data to see the impact...


Via Lauren Moss
Aurélia-Claire Jaeger's curator insight, January 21, 2013 2:28 AM

Et en plus, c'est beau !