Visualization Techniques and Practice
16.3K views | +0 today
Follow
Visualization Techniques and Practice
How to use visualization techniques for nonprofits in areas like data analysis, learning, facilitation, and innovation
Curated by Beth Kanter
Your new post is loading...
Rescooped by Beth Kanter from visual data
Scoop.it!

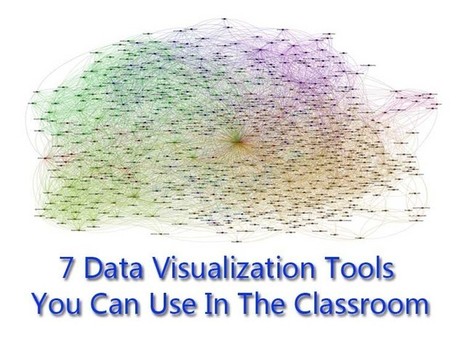
7 Data Visualization Tools You Can Use In The Classroom

7 Data Visualization Tools You Can Use In The Classroom | Visualization Techniques and Practice | Scoop.it

No matter what happens, there will always be a demand for data visualization tools. Data on its own can be pretty boring and brightening it up with images and other visual tools, it can make normally inaccessible information much easier to digest. (Editor’s Note: It’s also great for information reading literacy, and the new Common Core demand for multimedia “texts.”)


There are a number of fantastic tools out there that will present your data in an accessible manner. All of the tools listed below are free and chances are you’ve used one or two of the tools mentioned before.


Via Lauren Moss
bancoideas's curator insight, January 17, 2013 8:34 AM

Muy interesante!

Rescooped by Beth Kanter from visual data
Scoop.it!

Portfolio Infographic Design Kit

Portfolio Infographic Design Kit | Visualization Techniques and Practice | Scoop.it

A free resource from Tripwire Magazine: a useful portfolio infographics design kit you can use for your personal or business portfolio or CV.


For those looking for a simple and easy to tweak portfolio, take a look at this Infographics design kit- a tool for anyone updating a portfolio or CV to make it stand out. The elements come in PDS and Ai files...


Via Lauren Moss
No comment yet.