


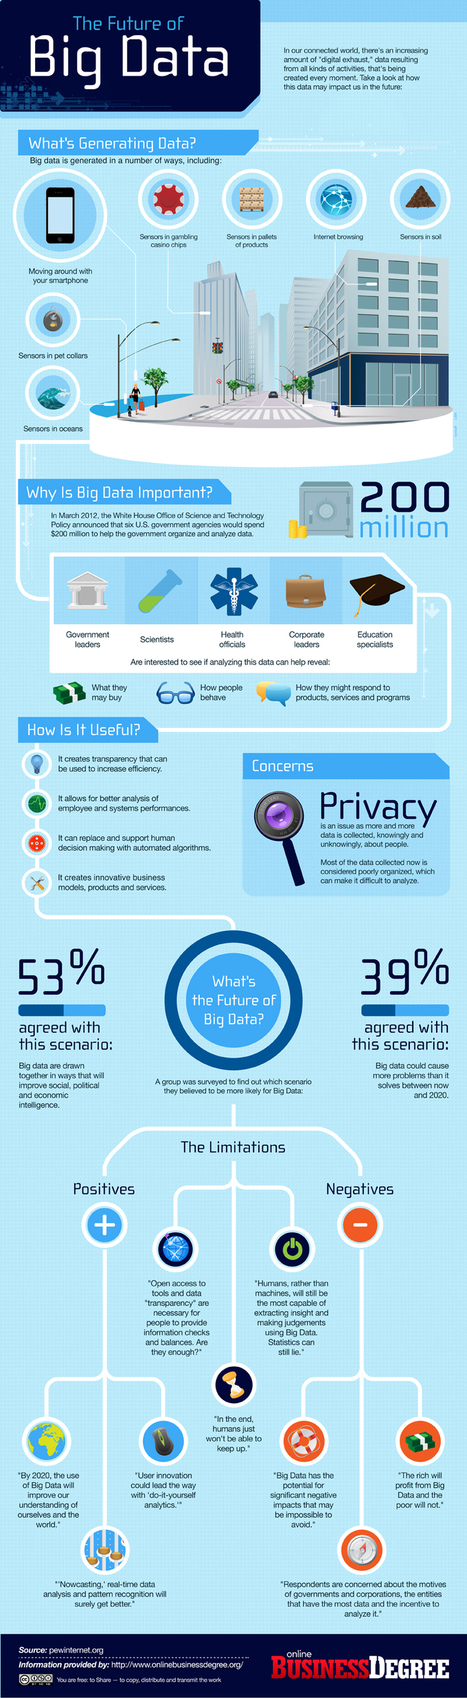
The quick reference guide to big data and data analytics; from the definition to the history and future applications of big data.
Via Lauren Moss
Get Started for FREE
Sign up with Facebook Sign up with X
I don't have a Facebook or a X account


 Your new post is loading...
 Your new post is loading...
Your new post is loading...
The quick reference guide to big data and data analytics; from the definition to the history and future applications of big data. Via Lauren Moss 
|
Big data is not new. It has existed for ages and can be attributed even to the initial years of computing. However, one might do well to consider why is there an increased buzz around this now. The answer is quite simple: Significant advances that have been brought about by x86 hardware have actually helped in bringing computing power to the masses. However, with new technologies, cloud computing has extended this power. Now, users have extended perimeters, while still being able to control costs effectively... Via Lauren Moss
|


Superbe infographie pour un résumé en image !
Big Data clarity from Deloitte....