Visualization Techniques and Practice
16.3K views | +0 today
Follow
Visualization Techniques and Practice
How to use visualization techniques for nonprofits in areas like data analysis, learning, facilitation, and innovation
Curated by Beth Kanter
Your new post is loading...
Rescooped by Beth Kanter from visual data
Scoop.it!

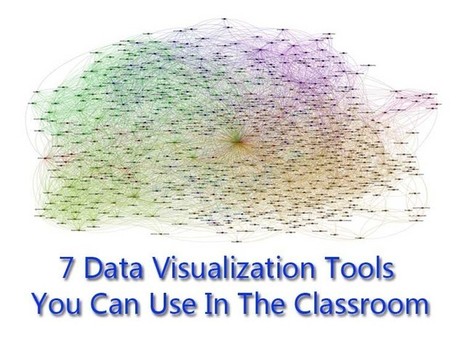
7 Data Visualization Tools You Can Use In The Classroom

7 Data Visualization Tools You Can Use In The Classroom | Visualization Techniques and Practice | Scoop.it

No matter what happens, there will always be a demand for data visualization tools. Data on its own can be pretty boring and brightening it up with images and other visual tools, it can make normally inaccessible information much easier to digest. (Editor’s Note: It’s also great for information reading literacy, and the new Common Core demand for multimedia “texts.”)


There are a number of fantastic tools out there that will present your data in an accessible manner. All of the tools listed below are free and chances are you’ve used one or two of the tools mentioned before.


Via Lauren Moss
bancoideas's curator insight, January 17, 2013 8:34 AM

Muy interesante!

Rescooped by Beth Kanter from visual data
Scoop.it!

Infographics: More Than Meets Eye...

Infographics: More Than Meets Eye... | Visualization Techniques and Practice | Scoop.it

The human brain processes visual information much faster and digests this type of content concurrently, whereas it takes more time to break text down. So, for many, it makes more than just sense to have your complex information delivered to your target audience in the most legible format...


Infographics make good use of brain’s ability to assimilate knowledge and information through the visual medium, making tough-to-crack-data appealing. Simply put, an infographic is a carefully composed collage of images, content, charts, stats, diagrams, animations & video to graphically represent information.

Infographics are used by various quarters such as educational institutions, acadamecians, businesses, newspapers, and just anybody who are serious about putting across their point in the most simplest manner. Infographics take different forms- venn diagrams, charts, timelines, maps and more. They are not merely a design or an image or random data; their purpose should be seen from every angle.


Visit the link to learn more about the process of creating infographics, how to implement online tools and resources, and best practices...


Via Lauren Moss
No comment yet.
Rescooped by Beth Kanter from visual data
Scoop.it!

5 Free Tools for Creating Infographics

5 Free Tools for Creating Infographics | Visualization Techniques and Practice | Scoop.it

Generally, people don’t have the time or energy to sit and plow through pages or screens of text; they want to be able to ingest information as quickly and easily as possible. With the recent rise of infographics (information graphics), what used to require an avalanche of stats or analyses to dissect, can now be interpreted and relayed into an easy-to-read, fun, and visually appealing schematic – and an excellent content marketing concept. Infographics, when designed well, can be applied to different online sites and social networks.

Summarized at the article are 5 free tools (with links) that allow you to start creating simple infographics or explore the potential of data visualization...


Via Lauren Moss
Cb Bowman's curator insight, September 10, 2013 12:33 PM

The Tools Needed To Get You Started in Using Infographics

Rescooped by Beth Kanter from visual data
Scoop.it!

6 Deadly Sins of Data Visualization

6 Deadly Sins of Data Visualization | Visualization Techniques and Practice | Scoop.it
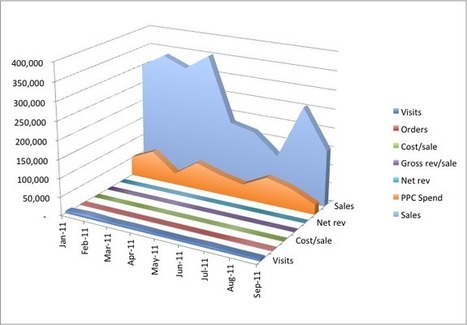
You’re a marketer. And half your job is marketing your ideas. Like it or not, you have to be good at proving your point, ‘cause being right isn’t enough. You have to justify the time, dollars and effort required for your internet marketing campaign. In the meeting room struggle for resources, your best weapon is great data presentation.

Events tell a story. and people more easily follow a story told visually than one told verbally.

Want to get better? Avoid these six gigantic visualization mistakes...


Via Lauren Moss
No comment yet.
Rescooped by Beth Kanter from visual data
Scoop.it!

Infographic Design Vector Elements: Resources for creating visualizations

Infographic Design Vector Elements: Resources for creating visualizations | Visualization Techniques and Practice | Scoop.it

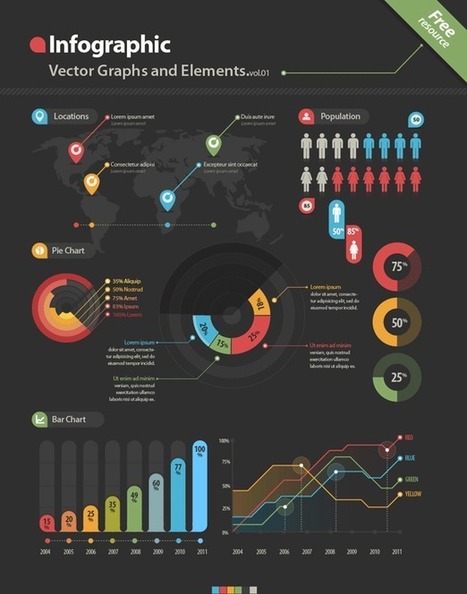
A collection of resoureces and links to free infographic design vector elements, including various graphics, charts, labels, pictograms, symbols, maps and more- for use in designing infographics and data visualizations.

Simply open the files in a vector based program and edit...


Via Lauren Moss
Dazhi Jiang's curator insight, December 12, 2012 5:35 AM

Infographic resources

Rescooped by Beth Kanter from visual data
Scoop.it!

Portfolio Infographic Design Kit

Portfolio Infographic Design Kit | Visualization Techniques and Practice | Scoop.it

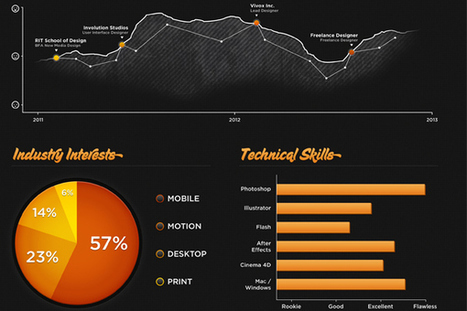
A free resource from Tripwire Magazine: a useful portfolio infographics design kit you can use for your personal or business portfolio or CV.


For those looking for a simple and easy to tweak portfolio, take a look at this Infographics design kit- a tool for anyone updating a portfolio or CV to make it stand out. The elements come in PDS and Ai files...


Via Lauren Moss
No comment yet.
Rescooped by Beth Kanter from visual data
Scoop.it!

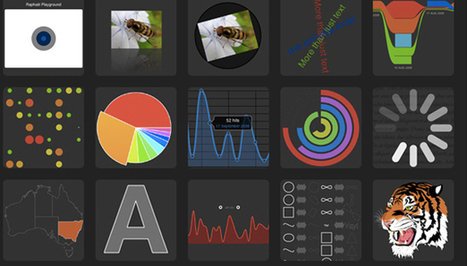
The top 20 data visualisation tools

The top 20 data visualisation tools | Visualization Techniques and Practice | Scoop.it

From simple charts to complex maps and infographics, Brian Suda's round-up of the best – and mostly free – tools has everything you need to bring your data to life...

A common question is how to get started with data visualisations. Beyond following blogs, you need to practice – and to practice, you need to understand the tools available. In this article, get introduced to 20 different tools for creating visualisations: from simple charts to complex graphs, maps and infographics. Almost everything here is available for free, and \you may have installed already...


Via Lauren Moss
Randy Rebman's curator insight, January 28, 2013 12:33 PM

This looks like it might be a good source for integrating infographics into the classroom.