Learn more about the value of data visualisation. Tableau's Jock Mackinlay explains why data is inert and worthless without the twin practices of visualisation and storytelling.
This is a quick piece that makes some valuable points. Frankly, I'm not a hard-core data head. Yet I love looking at spreadsheets, bar charts, line charts and other visual displays of data in order to make meaning of the material and spot trends.
There is a whole science to displaying data in meaningful ways (see Edward Tufte's work) that we don't need to go into here. But what I like about this article is that it points to the fact that all the data in the world is meaningless until you can tell the story about what it is saying and what it means.
Storytelling and data go hand-in-hand.
Truly, those of us in the field of business storytelling need to build our data skills. And data-geeks need to develop their storytelling skills. Sounds like a match made in heaven!
Here's another aspect of storytelling that this article alludes to: yes, we all know it takes time to share a story and in this fast-paced world, it is not uncommon to hear "But who has the time?! Just give me the data to share. We've got to get moving!" Ahhhhh -- huge mistake! Taking the time to share a story in the beginning makes projects go much more quickly.
That sounds counter-intuitive, but I experience this phenomenon again and again.
Read the article for additional points on how the marriage of data and storytelling make for better decision making. They are worth remembering.
This review was written by Karen Dietz for her curated content on business storytelling at www.scoop.it/t/just-story-it
Via
Bas Kooter,
Beth Kanter


 Your new post is loading...


![The 7 Key Components of a Knockout Infographic [INFOGRAPHIC] | Visualization Techniques and Practice | Scoop.it](https://img.scoop.it/9vHSDQlbHHSb1FjCFda7nzl72eJkfbmt4t8yenImKBVvK0kTmF0xjctABnaLJIm9)


![13 Reasons Your Brain Craves Infographics [Infographic] | Visualization Techniques and Practice | Scoop.it](https://img.scoop.it/drRLnCgu2GGUjqDC_MCtSzl72eJkfbmt4t8yenImKBVvK0kTmF0xjctABnaLJIm9)


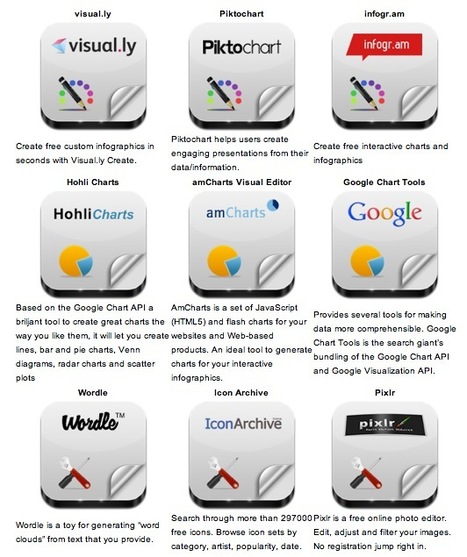
Good tools to make Infographics
Infographics voor zij die er nog steeds zot van zijn.
Infographics are great tools to present curated and focused content from a specific perspective.